
US BSL CLO Managers: Rankings Based on MVOC (BB)
Some of the larger managers in the top quartile include OHA, BSP, Allstate, BlackRock, Golub, and Oaktree.

Some of the larger managers in the top quartile include OHA, BSP, Allstate, BlackRock, Golub, and Oaktree.

Seven EU CLO managers with smaller platforms performed strongly, with most of their deals ranking in the top quintile.

Notably, EU CLO equity NAV metrics surpass those of their US BSL CLO counterparts across all vintages except for 2022 and 2023 deals, despite the latter having considerably more diversified underlying portfolios. In particular, the equity NAV metrics of EU CLOs from the 2013–2014 and 2018 vintages are markedly higher than those of their US counterparts.

This article focuses on US BSL CLO deals that exited their reinvestment period (RP) in 2023, based on a sample of 386 deals. As shown in the table below, the median annualised prepayment rate was 20% in year 1, with a wide range—from 12% to 27%—based on the 25th and 75th percentiles. In year 2, the median annualised prepayment rate rose to 34%, while the interquartile range narrowed compared to year 1.

As these deals exited their reinvestment periods in 2022—a year marked by significant volatility—27 out of 67 managers sustained average single-digit annualised prepayment rates across their deals in the first year post-RP, as shown in the table below.
This analysis examines a sample of 966 deals currently within their reinvestment periods.

This study includes a sample of 439 seasoned deals that have concluded their reinvestment periods.
Cairn CLO X equity recently traded with a released cover price of EUR 46.3, equating to a primary equity IRR of 13.7%. Its strong performance was largely driven by a solid annual distribution of over 18% sustained over more than six years.

A more objective way to evaluate a manager’s capability is by examining the inception-to-date gross annualised collateral return of their deals, measured relative to the relevant loan indices and assessed on an unlevered basis. This provides a clearer measure of true alpha generation.
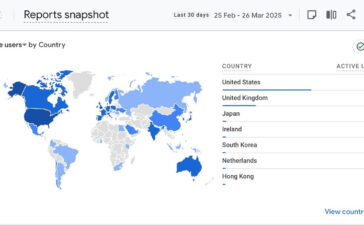
Here are the top 7 countries with the highest user activity over the past month.

Some of the more successful and consistent managers include CSAM, KKR, and CVC. Notably, CSAM, CVC, and KKR are top-ranked, with over 70% of their deals in the sample falling within the top 25%. Among managers with only two or three deals in the sample, Spire Partners and CIFC have also performed well, with at least two-thirds of their deals in the top quartile.

Based on a sample of 116 EU CLO deals that have either already been redeemed or are expected to be fully redeemed soon, equity tranches from the 2020, 2022, and 2023 vintages delivered particularly strong returns. These deals stood out with impressive final IRRs, supported by healthy equity NAVs at exit. The final table in this article presents each manager’s average IRR, annual distribution, and equity NAV across their redeemed deals, along with the percentage of those deals that ranked in the top quartile for equity IRR performance. Of the 41 managers in the sample, 23 achieved an average equity IRR of 10% or higher on their redeemed CLOs.

To calculate the total/MV/interest return alpha, we begin by determining the total/MV/interest investment return for each complete period, such as from a deal’s closing date to the most recent reporting date. This is achieved by compounding the portfolio’s monthly (or periodic) total/MV/interest return since the closing date. We then annualise the total/MV/interest portfolio return and compare it with the annualised return of the index. The difference represents the total/MV/interest return alpha, as illustrated here.

Despite this setback, CSAM made a strong recovery and, since August 2021, has outperformed its peers thanks to above-average metrics for MV and interest return alpha as shown in the second and third graphs.

Although Redding Ridge’s interest return alpha metrics have been below average, it has outperformed its peers since August 2023 by a good margin thanks to its impressive MV return alpha outperformance. As illustrated in the graphs below, this demonstrates the success of its proactive portfolio management style.