
Top Educational Articles Since 2025
Since early 2025, the three educational articles below have collectively garnered over 7,500 views, underscoring continued interest in succinct, practical and relevant CLO content.
Since early 2025, the three educational articles below have collectively garnered over 7,500 views, underscoring continued interest in succinct, practical and relevant CLO content.


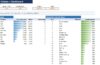
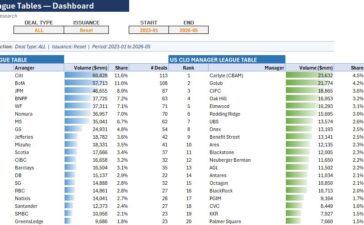
Please find the download link below for the interactive US primary and reset CLO issuance arranger and manager league tables. Users can customise the analysis by selecting the relevant date windows and deal types, with the arranger and manager rankings updating automatically based on the chosen criteria. Generally speaking, resets could offer substantial benefits to both debt and equity investors. From a debt perspective, a reset resembles a significant prepayment event, with all debt tranches prepaid at par. Lower mezzanine tranche investors, in particular, typically favour deals with a higher likelihood of being reset, as it provides a safeguard similar to an effective insurance policy. For underperforming deals, lower mezzanine tranches with low MVOCs might trade at a discount, even in strong loan markets. A reset pulls these tranches back to par, thereby mitigating losses. Equity investors could also derive considerable value from resets.


Please find the download link below for the latest interactive US primary and reset CLO issuance arranger and manager league tables. Users can customise the analysis by selecting the relevant date windows and deal types, with the arranger and manager rankings updating automatically based on the chosen criteria. From a debt perspective, a reset resembles a significant prepayment event, with all debt tranches prepaid at par. Lower mezzanine tranche investors, in particular, typically favour deals with a higher likelihood of being reset, as it provides a safeguard similar to an effective insurance policy. For underperforming deals, lower mezzanine tranches with low MVOCs might trade at a discount, even in strong loan markets. A reset pulls these tranches back to par, thereby mitigating losses. Equity investors could also derive considerable value from resets.


Arbitrage in the first half of 2025 was healthy, supported by wider asset spreads and tighter liability prints. In the second half of 2025, however, it generally ranged between 144 and 156 bps. When volatility spiked in February 2026, arbitrage improved to levels seen in early 2025, although it subsequently narrowed again, with the latest readings in the range of 150–160 bps.


A sample of 542 EU CLO deals is used in this study. Called deals and static deals are excluded from the sample.


Please find the download link below for the latest interactive US primary and reset CLO issuance arranger and manager league tables. Users can customise the analysis by selecting the relevant date windows and deal types, with the arranger and manager rankings updating automatically based on the chosen criteria. From a debt perspective, a reset resembles a significant prepayment event, with all debt tranches prepaid at par. Lower mezzanine tranche investors, in particular, typically favour deals with a higher likelihood of being reset, as it provides a safeguard similar to an effective insurance policy. For underperforming deals, lower mezzanine tranches with low MVOCs might trade at a discount, even in strong loan markets. A reset pulls these tranches back to par, thereby mitigating losses. Equity investors could also derive considerable value from resets.


