

“Learning never exhausts the mind.” – Leonardo da Vinci
Have you ever wondered how CLO tranche ratings—AAA, AA, A, BBB, and BB—are determined from a portfolio of non-investment-grade loans, typically rated B+/B/B-?
This article aims to explore this question in a straightforward manner.
At the heart of CLO rating creation lies the concept of the waterfall structure or credit subordination. Before exploring credit subordination, let us first examine the factors that drive a portfolio’s credit risk profile.
Three critical factors shape a portfolio’s credit loss profile:
- Probability of default (PD) for each loan in the portfolio, influenced by its credit rating and tenor.
- Recovery rate (or loss given default, LGD).
- Default correlation between loans, which depends on factors such as sub-industry, industry, region, and country.
Consider a portfolio consisting of 50 credits across various industries, with a weighted average PD of 20% over eight years and a weighted average recovery rate of 50%. Would running 10,000 scenarios (using the Gaussian copula function) yield a portfolio credit loss of 20%×50%=10% in every scenario? The answer is no.
Why not? The key lies in default clustering, which is driven by default correlation.
Companies tend to have a higher default correlation with others operating within the same industry compared to those in different sectors. However, not all companies in a struggling industry will meet the same fate; some may still succeed even as their peers face insolvency. This dynamic helps explain why default correlation within the same industry is often lower than commonly perceived.
As companies are real, functioning businesses, they can often respond to difficulties by cutting costs, restructuring, or transforming their operations. This adaptability may help explain the impressive performance of CLO-rated tranches (backed by corporate loans) over multiple credit cycles.
Moreover, a typical CLO portfolio is well-diversified across regions and industries. This raises an important question: what are the chances of observing default clusters spanning multiple industries?
Returning to the shape of the portfolio credit loss curve, one might anticipate the presence of tail risk— a low probability of experiencing significant losses. Assuming an intra-industry default correlation of 30% and an inter-industry default correlation of 5%, the resulting credit risk profile would resemble the example outlined in the table below:
| Table 1 | Portfolio credit losses |
| Expected Loss (%) | 10.0% |
| Max | 30.0% |
| Value @ Risk (%) | |
| 5.0% | 18.8% |
| 4.0% | 19.3% |
| 3.0% | 20.0% |
| 2.0% | 21.0% |
| 1.0% | 22.8% |
| 0.5% | 24.3% |
| 0.1% | 27.0% |
As illustrated in Table 1, the simplified modelling outcome (based on just 10,000 scenarios) indicates a 0.5% probability (or lower) that this portfolio could experience credit losses of 24.3% or greater.
Therefore, if a CLO tranche is capable of withstanding such a substantial level of credit loss, it merits a strong credit rating. But how is this achieved?
This is where the concept of the waterfall structure, or credit subordination, becomes essential. The AA-rated tranche is supported by lower-rated tranches, such as single-A to BB tranches, along with excess interest cash flows. As a result, the AA-rated tranche benefits from this protection, enabling it to withstand a significant level of portfolio credit loss.
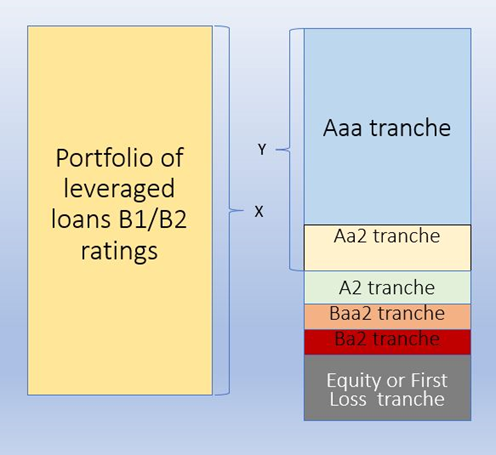
For example, from a waterfall perspective, the Aa2 tranche is well secured by the portfolio notional of X, with the over-collateralisation (OC) ratio at the Aa2 level calculated as X/Y. In addition, rated tranches can gain further protection from excess interest cash flows, which may be redirected away from the equity tranche or lower-rated tranches to pay down the AAA tranche if any OC tests are breached. In certain cases, excess spreads are designed to pay down a Class X tranche or, for instance, a mezzanine tranche over time, thereby enhancing the structural leverage of the deal.
If a CLO tranche can withstand up to 27% of credit losses under various default timing and interest rate scenarios without defaulting, it may qualify for an AA rating. According to Table 1, there is a 0.1% probability (or lower) that the underlying portfolio could incur 27% or more credit losses. By comparing this 0.1% probability to the rating agencies’ probability of default (PD) benchmark table, we can identify the rating corresponding to this PD—an AA rating, based on the tranche’s weighted average life.
Of course, the above example is a simplified illustration. The aim of this article is to demonstrate how CLO technology operates, enabling the creation of robust CLO tranche ratings from a portfolio of non-investment-grade loans.
Rating agencies have a highly comprehensive approach to rating CLOs. While Moody’s and S&P have their methodologies, the fundamental concept is the same even though Moody’s uses the expected loss (EL) approach. Nonetheless, there are two components involved – portfolio credit risk profile and cash flow modelling.
For example, Moody’s uses the expected loss (EL) calculation to rate a CLO tranche. They typically use the binomial expansion technique to associate asset default scenarios with the likelihood of each scenario (a default distribution). They then use cash flow modelling that relates each assets’ default scenario to the cash flows that the rated tranche receives in that scenario. After applying the default distribution to the cash flow model, they calculate the EL for each tranche. Finally, they compare the tranche’s EL to the relevant EL benchmark, based on its weighted average life, to determine the rating associated with such an EL.
On the other hand, instead of using the EL approach, S&P first assesses the credit portfolio scenario default rate (SDR), which corresponds to the level of defaults that is likely to affect the portfolio in a given rating stress scenario. As a second step, S&P analyses the transaction’s cash flows and payment profile. S&P will test the various scenarios, based on key rating drivers to determine the maximum level of defaults that a tranche may sustain while still repaying the noteholders in full and on time. This is the breakeven default rate (BDR). To assign a rating at a given level, S&P looks for the SDR commensurate with that rating to be at or lower than the BDR.
While Moody’s uses the EL approach and S&P uses SDR vs BDR approach, there are two components involved – portfolio credit risk profile and cash flow modelling.
Disclaimers
The information, research, data, research related opinions, observations and estimates contained in this document have been compiled or arrived at by CLO Research Group, based upon sources believed to be reliable and accurate, and in good faith, but in each case without further investigation. None of CLO Research Group or its service providers; authorised personnel, or their directors make any expressed or implied presentation or warranty, nor do any of such persons accept any responsibility or liability as to the accuracy, timeliness, completeness or correctness of such sources and the information, research, data, research related opinions, observations and estimates contained in this document. All information, research, data, research related opinions, observations, and estimates in this document are in draft form as of the date of this document and remain subject to change and amendment without notice. Neither CLO Research Group nor any third-party providers shall be subject to any damages or liability for any errors, omissions, incompleteness or incorrectness of this document. This article is not and should not be construed as an offer, or a solicitation of an offer, to buy or sell securities and shall not be relied upon as a promise or representation regarding the historical or current position or performance of any of the deals or issues mentioned in it.