
Realised IRRs by Vintage for Fully Repaid EU CLO AAA-rated Tranches
A sample of 642 fully repaid EU CLO AAA floating-rate tranches with disclosed issue prices or DMs is included in this study.

A sample of 642 fully repaid EU CLO AAA floating-rate tranches with disclosed issue prices or DMs is included in this study.
A sample of 550 fully repaid EU CLO BBB-rated floating-rate tranches with disclosed issue prices or DMs is included in this study.

Please see the tables below for the latest median MVOC metrics across the US and EU CLO capital structure.

A sample of 554 EU CLO deals (vintage 2013–1H 2025) is included in this study. Deals with a collateral pool factor below 60% are excluded. The MVOC at the BB level is used for the assessment of managers' capital preservation performance because it is less affected by deleveraging than the corresponding MVOC percentiles at the AAA, AA, or single-A levels, making it a more meaningful measure.

A sample of 1,640 US BSL CLO deals (vintage 2013–1H 2025) is included in this study. Deals with a collateral pool factor below 55% are excluded. The MVOC percentile at the BB level is used because it is less affected by deleveraging than the corresponding MVOC percentiles at the AAA, AA, or single-A levels, making it a more meaningful measure of principal preservation.

Recently, CLO Research published an overlap optimisation model covering almost all outstanding US BSL, middle-market and EU CLO deals. Users can use the model to optimise their CLO investment positions and minimise overlap risk.

Below are tables presenting the MVOC (AAA–B) and equity NAV of US BSL and EU CLO deals by vintage, based on asset prices as of 17 July 2026.
A sample of 538 fully repaid EU CLO BB tranches with disclosed issue prices or DMs is included in this study. Overall, their performance has been very impressive, with an average realised IRR of 10.1%.
Below are tables presenting the MVOC (AAA–B) and equity NAV of US BSL and EU CLO deals by vintage, based on asset prices as of 13 July 2026.

A sample of 560 EU CLO deals (vintage 2013–1H 2025) is included in this study. Deals with a collateral pool factor below 60% are excluded.

A sample of 1,646 US BSL CLO deals (vintage 2013–1H 2025) is included in this study. Deals with a collateral pool factor below 55% are excluded.

This week saw 22 line items of longer-dated EU CLO single-B bonds, totalling EUR 66.8 million, trade with released cover levels according to SCI's BWIC data. All of the bonds have reinvestment periods ending in 2029 or 2030. DMs ranged from a tight 870 to 973.
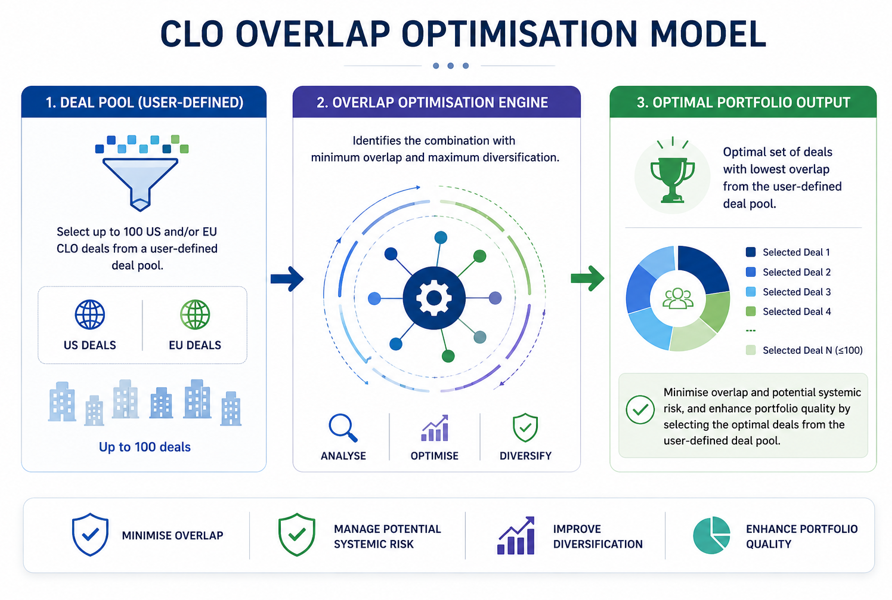
Please find the download link in this article for the overlap optimisation model. The model allows users to select up to 100 US and/or EU CLO deals from a user-defined pool of deals and identifies the optimal combination to minimise overlap.

The 2018 vintage has experienced the highest impairment rate so far, with approximately 19% of single-B rated tranches having become impaired. Unfortunately, this rate is expected to rise further...

A sample of 573 EU CLO deals (vintage 2013–1H 2025) is included in this study. Deals with a collateral pool factor below 60% are excluded.